What 395 business idea checks show: 2026 statistics

We ran 395 business ideas through our idea check and counted what the reports found. “Worth building” went to 22% of them, and “Competition” was the part of an idea that most often cost it points.
- Of 395 US ideas, 22% got “Worth building”; the median score was 60 out of 100.
- “Competition” was the costliest axis in 49% of the checks.
- An existing offer covered 60% or more of the idea in 64% of the checks.
- Where unit economics could be estimated, 36% fell below LTV:CAC 3:1.
Key findings
We counted what 395 idea checks for 117 US niches found, using the pages published on this site as of October 15, 2026. All figures below are medians and shares of those checks.
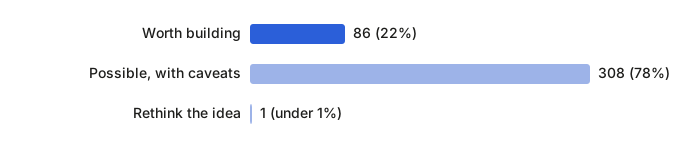
- Of 395 ideas, 86 (22%) got the verdict “Worth building” and 308 (78%) got “Possible, with caveats”.
- Half of the ideas scored between 57 and 64, around a median of 60 out of 100.
- “Competition” was the axis that cost an idea the most points in 192 checks (49%).
- An existing business already offered at least 60% of the idea in 251 of 392 checks (64%).
- Where unit economics could be estimated (220 checks), LTV:CAC fell below 3:1 in 79 (36%).
- All 117 niches had at least one recorded business closure.
- Our 127 checks of Russian niches gave “Worth building” to 20% of ideas and put LTV:CAC below 3:1 in 58% of the estimates.
How many ideas are worth building
Every idea gets a score out of 100 and a verdict from the check. Of the 395 US checks, 86 (22%) got “Worth building”, 308 (78%) got “Possible, with caveats” and one got “Rethink the idea”. Every check had enough data for a verdict.
Scores sit in a narrow band. The median is 60, the middle half of the ideas falls between 57 and 64, and the lowest and highest scores were 44 and 76.
| score | checks | share |
|---|---|---|
| 40 to 49 | 13 | 3% |
| 50 to 59 | 160 | 41% |
| 60 to 69 | 212 | 54% |
| 70 to 79 | 10 | 3% |
Verdicts follow the score. Every “Worth building” idea scored 65 or more, while “Possible, with caveats” covered scores from 45 to 69. An idea that scores 65 or more can still get “Possible, with caveats” when the check finds a stop factor or measured too little of it.
Which part of an idea costs it the most points
A check’s score adds up nine weighted axes. For each check we took the measured axis with the largest weighted shortfall from a full score: the part of the idea that cost it the most points.
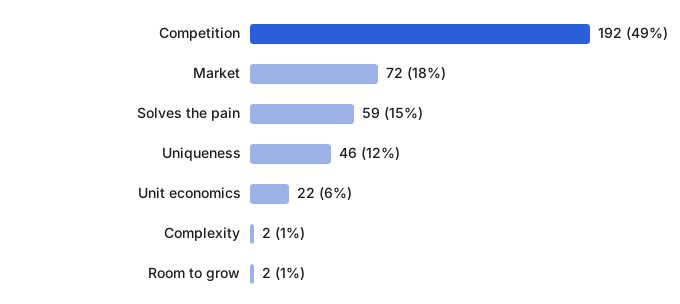
“Competition” led in 192 checks (49%), followed by “Market” in 72 (18%). “Unit economics” cost the most points in 22 checks (6%). “Demand” never did, because it had no data in any check (see the limits below).
A stop factor is rarer: 20 checks (5%) hit one, 14 on competition and 6 on uniqueness. A stop factor, such as a market crowded with direct rivals or an offer that already exists almost as it is, holds the verdict at “Possible, with caveats” at most, whatever the score.
How crowded the niches are
Our check counts the direct competitors it finds in search results and on maps for the idea’s place. A median idea faced 7 direct competitors, and 25 checks (6%) found none at all. A big player was present in 42 checks (11%).
Overlap tells more than the count. For each idea the check estimates how much of its offer the closest existing business already covers. The median overlap was 60%, and in 251 of 392 checks (64%) it reached 60% or more.
To map the rivals of your own idea, start with our competitor analysis guide.
Unit economics: where the numbers hold up
Unit economics needs a price, a margin, a purchase frequency and the cost of winning a customer. Our check could estimate them on the category’s norms in 220 of 395 checks (56%). In the other 175 the axis had no data and stayed out of the score.
Where it was estimated, the median LTV:CAC was 4.2. Of those checks, 79 (36%) fell below 3:1, the ratio widely cited as the floor for sustainable growth1, and 22 (10%) were below 1:1, where a customer costs more to win than they bring back.
Payback took a median of 2.2 months, and 18 checks (8%) needed more than 12 months, longer than the common target for SaaS companies2.
These are estimates on category norms, made before launch. Work out your own numbers with the unit economics guide.
How many people search to start these businesses
For every niche page we measure how many people search Google each month for ways to start that business, with queries such as “how to start a … business”. Across the 117 US niches the median was 910 searches a month.
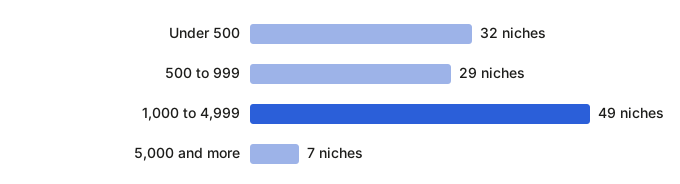
Of these niches, 32 had fewer than 500 such searches a month and 7 had 5,000 or more.
An idea’s own demand axis is a different measure: the search volume of the buying query for that idea in its place. It had no data in any of the 395 checks, so the scores above leave it out and share its weight among the other axes. To test demand for your own idea, see how to check demand.
Closures and complaints in these markets
Each niche page lists businesses of that kind that closed, with the reason from a public source. All 117 US niches had at least one recorded closure, and the median niche had 5.
Customer complaints about the existing offers turned up in 393 of 395 checks (99%), a median of 7 quotes per check.
Closures and complaints are part of the data a niche page needs before it is published, so these counts show how easy they are to find. They do not measure how often such businesses fail.
Scores by category
This table lists the categories with at least 10 checks. Their median scores run from 58 to 63, and the share of “Worth building” verdicts from 8% in Auto to 33% in Food.
| category | checks | median score | worth building |
|---|---|---|---|
| Food | 54 | 62 | 18 (33%) |
| Retail | 48 | 60 | 10 (21%) |
| Travel and leisure | 43 | 60 | 8 (19%) |
| Beauty and health | 35 | 60 | 7 (20%) |
| Ecommerce | 31 | 62 | 7 (23%) |
| Personal services | 31 | 60 | 5 (16%) |
| Online and media | 27 | 63 | 9 (33%) |
| Other | 26 | 59 | 4 (15%) |
| B2B services | 25 | 62 | 7 (28%) |
| Auto | 24 | 59 | 2 (8%) |
| Home and construction | 16 | 61 | 4 (25%) |
| Agriculture | 12 | 58 | 2 (17%) |
| Pets | 12 | 58.5 | 1 (8%) |
| Kids and education | 11 | 58 | 2 (18%) |
Every niche with its checked ideas is in the business ideas catalogue.
Ideas tied to a city and ideas without one
Of the 395 checks, 331 were run for a named city. The other 64 named no city: online businesses, rural or regional ones and services sold across the country.
| ideas | checks | median score | worth building |
|---|---|---|---|
| with a city | 331 | 60 | 70 (21%) |
| without a city | 64 | 61 | 16 (25%) |
Online ideas have a catalogue page of their own: online business ideas.
The US and Russia side by side
We run the same check for Russian niches, on Russian data and in Russian. By the same date 127 checks of 36 Russian niches were published. This table compares the measures the two sets share.
| measure | US | Russia |
|---|---|---|
| idea checks | 395 | 127 |
| “Worth building” | 22% | 20% |
| median score | 60 | 60 |
| the axis that cost the most points | Competition, 49% | Competition, 44% |
| closest offer covers 60% or more | 64% | 53% |
| median direct competitors | 7 | 6 |
| unit economics estimated | 56% | 77% |
| median LTV:CAC | 4.2 | 2.2 |
| LTV:CAC below 3:1 | 36% | 58% |
| median payback, months | 2.2 | 4.6 |
Niche demand is left out of the comparison: the US figures are Google search volumes and the Russian ones are Yandex search data, two scales that do not match. One Russian check had too little data for a score and is left out of the score medians.
Methodology and limits
- Data: the 395 US idea pages and 117 US niche pages published on this site in the snapshot of October 15, 2026, and 127 idea pages and 36 niche pages for Russia. US checks ran from October 11, 2026 to October 15, 2026.
- Ideas: our niche research drafted several typical ideas for each niche and ran each through the same idea check a founder uses. They were not submitted by founders, and the set holds no person’s data.
- Selection: only published pages count. 51 more US idea checks and 15 niches failed our publication rules (sources, measured demand, enough data, no near-copies) and stayed out.
- Definitions: the score, the verdicts and the axes are the check’s own, described on how we make the pages. Our derived measure is the axis that cost the most points: the measured axis with the largest weighted shortfall from a full score. Every median counts only the checks where the value was measured.
- What it does not show: success rates. A check estimates an idea before launch, and we did not follow what happened next. Unit economics are category norms, and the market data comes from public sources on the day of the check.
Download the data
This study’s figures form a data set, “Business idea check statistics (US and Russia)”: a CSV file with one row per figure, giving the market, the measure, its group, the value, the base it was counted on and the snapshot date.
License: CC BY 4.0. You may reuse the figures in your own work with a link to this page as the source.
FAQ
How many business ideas are worth pursuing?
In our 395 US checks, 22% of ideas got “Worth building” and most of the rest got “Possible, with caveats”. A check scores an idea before launch, so a verdict is a starting point for your own tests.
What usually makes a business idea score low?
Competition, more often than any other axis: it cost the most points in 192 of 395 checks. In many of them a rival already sold most of the idea.
Can I use these numbers in my own article?
Yes. Our data file is published under CC BY 4.0: cite this page as the source.
Sources
- stealthagents.com, 06/30/2026
- stackmatix.com, 09/12/2026
Check your idea for free
Describe your idea and the check collects demand, competitors, complaints and prices, with sources.