


How to Do a Market Analysis in 7 Steps (With a Worked Example)

To do a market analysis, answer four questions before you spend money: who buys; how many buyers there are and what they pay; who already sells to them; and whether one customer earns back the cost of winning them. You get there in seven steps, from writing down the decision to running the unit economics. Each step below names its output and where the data comes from. One real idea check runs through all seven.

The check sizes the market, lists direct competitors, groups customer complaints and runs the unit economics. The worked example below is one such check.
The seven steps at a glance
- Write down the decision: one sentence, plus the number that would change it.
- Draw the market’s borders and name the customer: write four borders and one segment.
- Size the market: give the three sizes (TAM, SAM, SOM) with their inputs, or state the gap.
- Map the competitors in a table of direct and indirect rivals.
- Check trends and barriers: list dated trend signals and the barriers you find.
- Collect customers’ own words and group the complaints into themes with counts.
- Run the numbers: work out revenue, LTV, LTV to CAC and payback, each in three scenarios.

What a market analysis is (and what it isn’t)
A market analysis is a written answer to those four questions for one market and one customer, tied to one decision. It has four parts: the size of the market, its customers, its competitors and the economics of serving one customer.
Three neighbors get confused with it:
- Market research collects the data. The analysis turns that data into an answer for one decision.
- A SWOT analysis summarizes findings in four boxes. It does not produce them.
- In a business plan, the market analysis is one section, and the revenue forecast should be built from it.
PESTLE, Porter’s five forces and TAM/SAM/SOM are lenses you can apply inside these steps. This guide uses TAM/SAM/SOM for sizing and a competitor table for the competitive picture.
How to do a market analysis in 7 steps
Each step ends with its output and where to get the data. Work in order. If a step fails, for example the market at Step 3 is too small, you skip the rest and save the time.
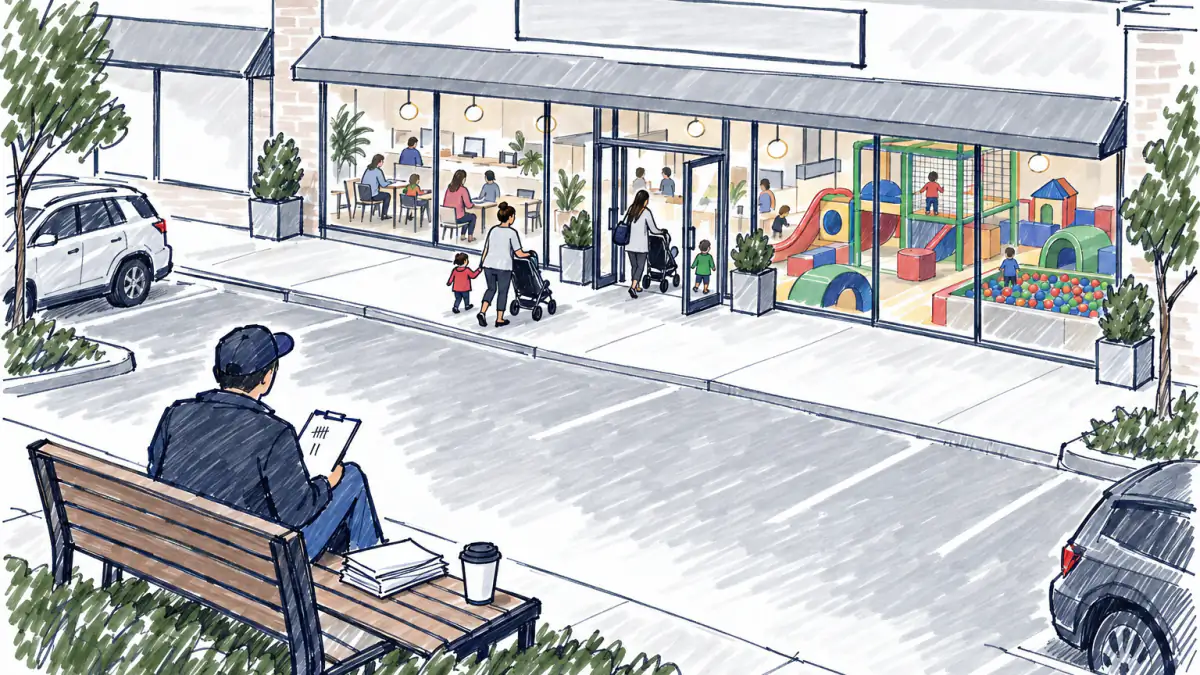
Step 1: Write down the decision it should settle
Write one decision and the number that would flip it. Typical decisions:
- Open or don’t open.
- Which customer segment to serve first.
- What price to charge.
The number is the threshold: “I open if one customer pays back their acquisition cost within their lifetime.” Once you sign a lease or pay for fit-out and ads, undoing it costs far more than editing a spreadsheet. That gap is the reason to run the analysis before you launch.
Output: one sentence with a decision and a threshold. Where to get it: your own plan.
Step 2: Draw the market’s borders and name the customer
Set four borders:
- Place: the area your customers come from.
- Customer: who pays, which can differ from who uses.
- Job to be done: what the customer hires the product for.
- Price band: the range they already pay for the same job.
Then split the customers inside those borders into segments by criteria you can observe. For a children’s venue, that means the age of the child, the distance from home and the visit pattern. Write one segment out in full. Example (assumption): parents of children under 6 who live within a 15-minute drive and come on weekday mornings. When you talk to them, write down their exact words. You will reuse them at Step 6.
Output: four borders and one segment. Where to get it: your own notes first, then the public counts from Step 3.
Step 3: Size the market
TAM means total addressable market; SAM, serviceable addressable market; SOM, serviceable obtainable market.1 TAM is everyone who buys this kind of product. SAM is the part inside your Step 2 borders. SOM is the share of SAM you can win in year one.
Build SAM from the bottom up:
SAM a year = buyers inside your borders × purchases per buyer a year × price
Use a published top-down figure, such as a national industry size, only as an outer bound. If your bottom-up SAM comes out larger than it, one of your inputs is wrong.
If no one has measured demand in your area, write that gap into the analysis. Keep the national figure as the ceiling, and count buyers from public data. A national total presented as local demand misleads you and anyone who reads the plan.
| Source | What it gives you | Cost |
|---|---|---|
| American Community Survey | population by age, including under 5, by county2 | public tables |
| County Business Patterns | establishments by NAICS industry and county3 | public tables |
| BLS QCEW | employment and wages by industry4 | free download |
| BEA | GDP by industry and by state5 | public tables |
| SEC EDGAR | 10-K annual reports of public companies6 | free search |
| S&P Global, MarketResearch.com | industry reports | paid7 |
Your industry description covers four items:
- Size: each of the three market figures (TAM, SAM, SOM) with its year.
- Growth: a dated series, never a single adjective.
- Major players: the largest operators, named.
- Regulation: the licenses and rules that apply to your use.
For the arithmetic, use the market size calculator.
Output: all three figures, or the two you can support plus a stated gap. Where to get it: the table above.
Step 4: Map the competitors
Split rivals into two groups. Direct rivals sell the same thing to the same customer within your borders. Indirect rivals solve the same job another way; for a play café, a library story hour or a public playground does that.
Record each rival in the same columns:
| Column | What to record |
|---|---|
| Name | the business, marked direct or indirect |
| Offer | what the customer gets |
| Price | per visit, pass or package |
| Where customers find them | search, maps, social, referrals |
| Review complaints | the repeated complaint, quoted |
Then measure attention. Our check records each direct rival’s visibility share: the share of visibility the check measured across the search results it collected. The rival with the largest share holds the most attention. The rival whose offer matches yours most closely can hold a small share and still be the bigger threat. The check lists your direct competitors with their visibility. For the full method, see competitor analysis.
Output: the filled table. Where to get it: search results, maps listings, rivals’ websites and their reviews.
Step 5: Check trends and barriers to entry
Every trend signal needs a source and a period. “Establishments in your NAICS code in your county, earliest to latest published year, County Business Patterns” is a trend. “The market is growing” is an opinion. Useful series:
- Establishment counts by industry and county.3
- Employment and wages by industry.4
- GDP by industry and state.5
- Growth plans and store counts in public operators’ 10-K reports.6
Rivals also leave signals: they post jobs, open locations and change prices on their websites. Note the date you saw each one.
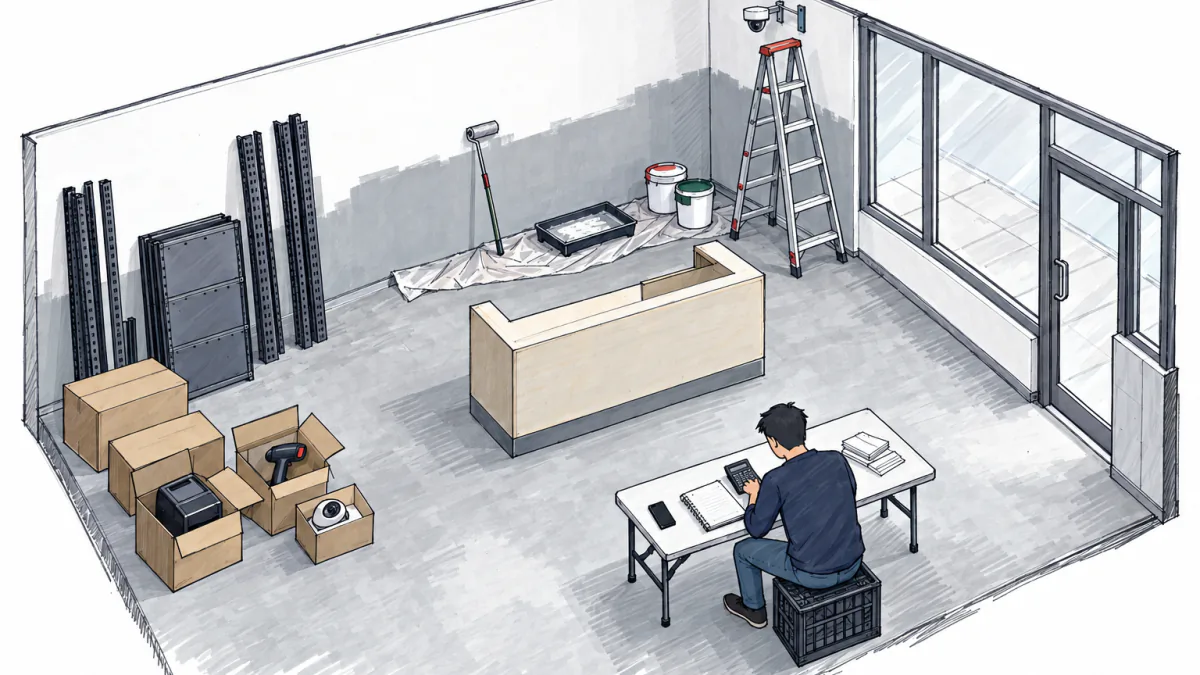
Barriers, each with one mitigation:
- Licenses and inspections (health, fire, building use): call the county office before you sign a lease.
- Lease and fit-out: ask for a rent-free fit-out period, or pick a space already built for children.
- Insurance: get a liability quote before you set the price.
- An entrenched rival: name where you differ, then test that difference at Step 6.
Rules differ by state and county, so check your own.
Output: three to five dated signals and a barrier list. Where to get it: the sources above and rivals’ sites.
Step 6: Collect customers’ own words
Primary research is data you collect yourself, for example through surveys or interviews. Secondary research uses data others have already published.8
| Primary | Secondary | |
|---|---|---|
| Cost | your time, incentives | often free, some paid |
| Speed | slower | faster |
| Control | you write the questions | fixed by the publisher |
| Examples | interviews, surveys, a test day | census tables, reports, reviews |
Start with secondary data you can count: the reviews of your direct rivals. Group the complaints into themes and count each theme. A theme that repeats across several rivals is a gap you can fill.
Two rules keep primary research honest. First, a survey of your own followers overstates demand, because they already like you. Second, in interviews ask about the last time someone did the thing (“Tell me about the last time you took your child somewhere indoors”); asking whether they would do it gets you guesses.
Output: complaint themes with a count for each, plus five to ten interview notes. Where to get it: review sites and maps listings, plus your own interviews.
Step 7: Run the numbers and decide
The formulas our check uses:
- Revenue a month = customers × purchases a month × price.9
- Gross profit = revenue − unit cost × units sold, which is revenue minus the cost of goods sold.9
- LTV = price × purchases a month × customer lifetime in months × margin.
- LTV to CAC = LTV ÷ CAC.
- Payback in months = CAC ÷ (price × purchases a month × margin).
Read the result with three rules:
- LTV to CAC below 1: each customer costs more to win than they bring back, so you lose money on every customer.
- Payback longer than the customer lifetime: the CAC never comes back.
- A figure taken from an industry norm rather than a local measurement: label it an assumption and list it as a risk.
An LTV-to-CAC ratio of 3:1 or higher is the widely cited benchmark for a healthy business.10 Run three scenarios, low, base and high, by moving the inputs you are least sure of. Compare each against your Step 1 threshold. Re-run the numbers when an input changes, such as a rival opening nearby or a new rent quote.
Output: a decision against the Step 1 threshold. Where to get it: Steps 3 to 6, plus real cost quotes (rent, staff, supplies).
Worked example: a toddler play café in suburban Atlanta
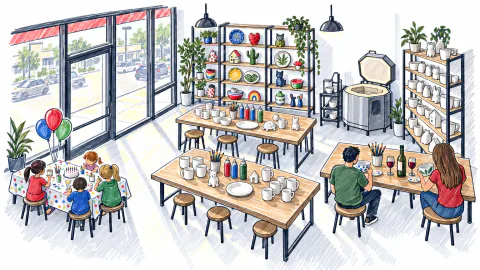
The idea, example by our method: «Drop-in indoor play café for toddlers in suburban Atlanta, Georgia: parents of kids under 6 paying per visit, punch cards and birthday party packages».ex In the example, the check ran 17 search queriesex and read 28 sources.ex It returned «Possible, with caveats»ex with a score of 63ex (example by our method).
Step 3. In the example, the check found no measured search demandex for the area. The only size figure is national, example by our method: $1.0 billion for 2024ex, from an IBISWorld industry report11 cited in the check. That figure is the TAM ceiling. The café’s SAM is a small slice of it, built from children under 5 in the target counties (American Community Survey2) × visits a year × price. The check computes no SAM, and neither does this guide.
Step 4. In the example, the check found 8 direct competitors.ex Five of them, with visibility shares, example by our method:
| Rival | Visibility share |
|---|---|
| Thrillz | 31%ex |
| The Kids Avenue | 27%ex |
| The Play Pad | 12%ex |
| Ready Set Fun | 10%ex |
| HippoHopp | 7%ex |
Ready Set Fun holds one of the smaller shares in the example and is still the first risk: it “already covers most of the concept in the same area, so visits may split between two venues.”ex
Step 6. Our method sorts the example’s complaints into four themes: Quality 4ex; Service and support 3ex; Reliability and trust 2ex; Other 1.ex Quality leads, which matches a risk the check lists: an unsafe or poorly kept space “could damage reputation quickly.”ex
Step 7. Inputs, example by our method: $30 a visitex, 1 visit a monthex, a 10-month lifetimeex, a $20 CACex and a 12% marginex, which is an estimate. LTV = $30 × 1 × 10 × 0.12 = $36ex (example by our method). LTV to CAC = $36 ÷ $20 = 1.8ex in the example, so each family returns its acquisition cost about 1.8 times, below the 3:1 benchmark.10 Payback = $20 ÷ $3.60 = 5.6 monthsex (example by our method), inside the 10-month lifetime.ex
All of Step 7 rests on that margin. The check flags this: the margin is “an estimate from food-service norms, not measured in suburban Atlanta,” and may not cover rent and staff.ex The check also notes two closed local cafés, where low sustained traffic left the business unable to cover fixed costs.ex
The verdict in the example stays «Possible, with caveats».ex The next action is to replace the estimated margin with real cost quotes (rent, staff, supplies), and to count weekday visits at the closest rivals before you sign a lease.

What to do next
Write your Step 1 sentence and your Step 2 borders first, because every later step depends on them. If the idea is still a sketch, shape it with the business concept guide.
FAQ
What’s the difference between market analysis and market research?
Market research collects data from surveys and interviews, and from published tables. A market analysis uses that data to answer one decision: who buys, how many, who competes, and whether one customer pays back.
Is a market analysis the same as a SWOT analysis?
No. A SWOT summarizes findings in four boxes after you have them. The market analysis produces those findings. Run the seven steps first, then fill in a SWOT.
What should a market analysis in a business plan include?
Include the market’s size (TAM, SAM, SOM with years) and its growth as a dated series. Name the major players and the regulations that apply, then describe your target segment and the unit economics behind the revenue forecast.
Where can I find free market data?
BLS QCEW files are free to download, and EDGAR searches 10-K reports at no cost. Census tables (American Community Survey, County Business Patterns) and BEA industry data are public government sources.
What’s the difference between primary and secondary research?
Primary research is data you collect yourself, for example in interviews or surveys. Secondary research uses data others already published, such as census tables, industry reports or competitors’ customer reviews.
How do I spot market trends?
Use dated series: establishment counts from County Business Patterns, employment from BLS QCEW, state GDP by industry from BEA. Add rivals’ job posts and new locations, and date each one when you see it.
Why do a market analysis before you launch?
Once you sign a lease or pay for fit-out and ads, undoing it is expensive. Writing the decision and the number that flips it, then checking that number, costs a few days instead of a signed contract.
Sources
- advertising.amazon.com, 11/30/2023
- data.census.gov, 10/03/2026
- census.gov, 06/18/2026
- bls.gov, 08/28/2026
- bea.gov, 05/02/2026
- sec.gov, 10/02/2026
- marketintelligencetools.com, 09/08/2026
- uk.surveymonkey.com, 10/11/2026
- quickbooks.intuit.com, 04/13/2022
- startups.com, 05/27/2026
- ibisworld.com, 09/10/2026
Check your idea for free
Describe your idea and the check collects demand, competitors, complaints and prices, with sources.


Comments 3 comments
Anna Price Columbus
Reading rivals' one-star reviews was the most useful hour of the whole exercise.
Tom Walker Austin
Sizing the market bottom-up gave me a third of the industry report's number. Smaller, but I can actually defend it.
Sara Lind Portland
Step 1 changed how I started: I wrote down the one decision the analysis had to settle, and half my research list went away.
Have a question or a view on the article? Ask Fox.