How to Build a Go-to-Market Strategy: 7 Steps and a Worked Example

A go-to-market strategy names your buyer and your sales channel before you spend money on a launch. It names who you sell to, how many of them there are and who already serves them. It says why they would switch, how you will reach them, what one customer is worth against the cost of winning them, and which numbers will tell you it is working. You build it in seven steps. Below, each step runs on one real idea check: a kitchen hood cleaning service in Nashville.
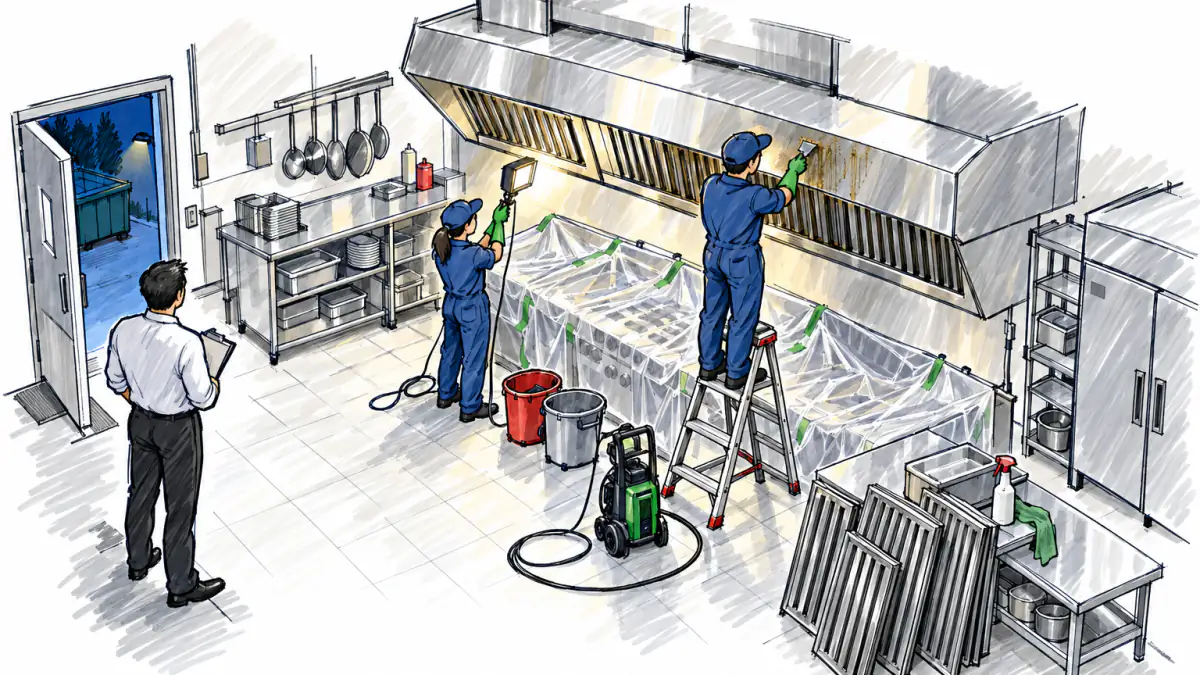
Key takeaways
- A go-to-market (GTM) strategy is the launch plan that ties one defined customer to a channel and price, and sets numbers you can check.
- The seven steps are: pick the customer, size the market, map the competitors, build the offer, choose the motion and channel, test the unit economics, set targets.
- Run one test before you pay for any channel. Customer lifetime value (LTV) must be higher than customer acquisition cost (CAC), and payback must arrive before the average customer leaves.
- The worked example scores 48ex and gets the verdict “Possible, with caveats”ex. Its money test fails at the stated inputs, and step 6 shows which lever repairs it.
What a go-to-market strategy is
Wikipedia defines a go-to-market strategy as a plan of an organization that uses outside resources, such as a sales force and distributors, to deliver its unique value proposition to customers and achieve a competitive advantage1. Harvard Business School Online adds two measures. Effectiveness is how rapidly you reach and convert customers. Efficiency is how profitable that effort is2.
Both measures need inputs you can write down. A GTM strategy answers seven questions in a fixed order, and each answer is a document you can hand to someone else on the team.
| Step | Component | The question it answers | What you produce |
|---|---|---|---|
| 1 | Target customer | Who buys first? | An ideal customer profile (ICP) table |
| 2 | Market size | How many buyers, how much money? | A bottom-up count |
| 3 | Competition | Who serves them now? | A rival map with visibility share |
| 4 | Offer and message | Why would they switch? | A value matrix |
| 5 | Motion and channel | How do you reach them? | One primary channel |
| 6 | Price and unit economics | Is a customer worth more than it costs to win? | LTV, CAC, payback |
| 7 | Targets | What tells you it works? | A pass line and a fail line |
Step 2 narrows the total market down to the part you can win in the near term, using TAM, SAM and SOM.
Writing the plan first shows whether the numbers work before you spend money, not after. You see the money case before the money is spent: if one customer returns less than it costs to win, you find that out on paper. You can cut the first version of the product or service to what the chosen customer will pay for, because you know which complaint you are selling against. The launch also starts sooner, since the channel, the message and the targets are fixed before the first outreach.
When you need one
Five situations call for a written GTM strategy:
- A new product. Write it when development is approved, so that what you build is aimed at the buyer you will launch to.
- A new segment or a new city. A service that sells to restaurants may not sell to hospitals. When the buyer changes, the channel and the price often follow.
- A relaunch. A product that stalled needs its customer and offer re-examined before more spend goes in, and the channel with them.
- Scaling an early win. The first customers often come through the founder’s network. The plan tests whether a paid or repeatable channel can bring the next ones at a cost the margin covers.
- Testing a market. A plan with a pass line and a fail line turns a vague “let’s see” into a test with an end date.
A local service business needs one too. A hood cleaning crew has no app or funnel, but it still has to decide whom to call first and what to charge per visit, plus how many visits pay for the outreach. The worked example below is such a crew.
Go-to-market strategy vs. marketing plan vs. business plan
The three documents nest. The GTM strategy is tied to one launch and ends when the launch has proved or failed its targets. The marketing plan runs inside it and continues after the launch. The business plan holds both, plus operations, funding and the company’s longer path. For the full document, see how to write a business plan.
| GTM strategy | Marketing plan | Business plan | |
|---|---|---|---|
| Focus | One product into one market | Demand and brand | The whole company |
| Timeline | The launch, usually one or two quarters | Ongoing, reviewed each year | Several years |
| Main output | Customer, channel, price, targets | Campaigns, calendar, budget | Financial model, funding need |
| Research | Customer, rivals, unit economics | Audience, messages, media | Market, team, operations |
| Owner | One accountable launch lead | Marketing lead | Founder or CEO |
When the GTM test passes, the marketing plan takes its channel and message, and the business plan’s financial model takes its unit economics.
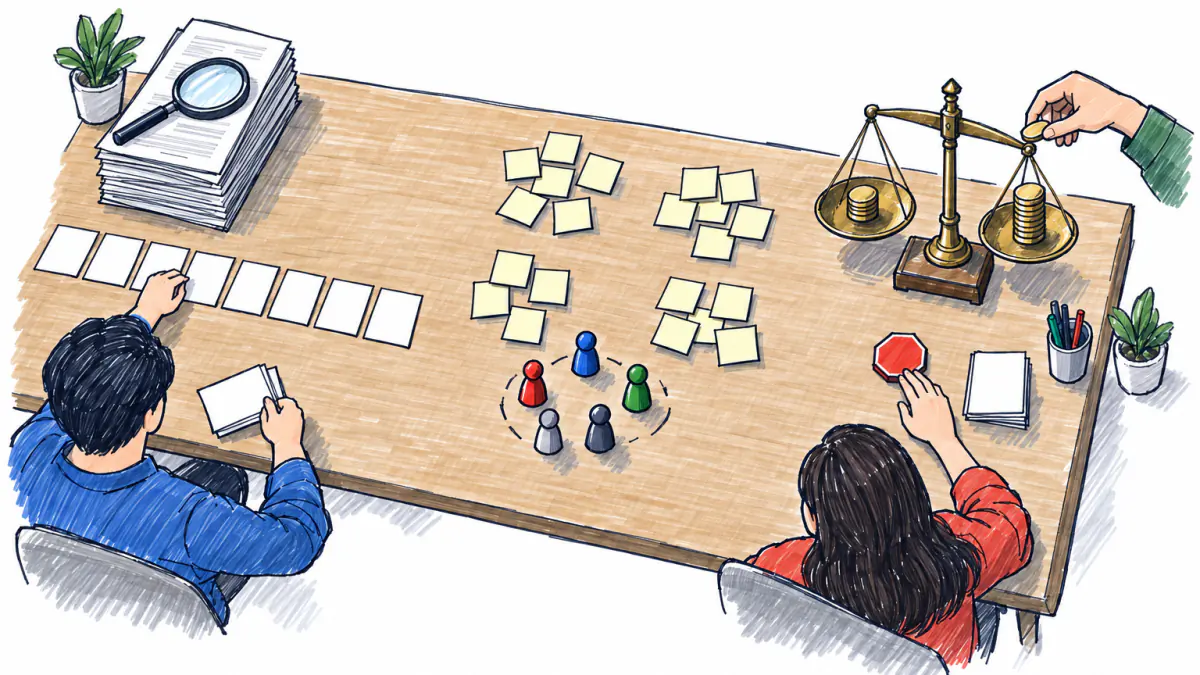
How to build a go-to-market strategy in 7 steps
Each step below ends in one deliverable with a named owner and uses a figure from the worked example. Step 6 is a gate: if LTV is below CAC, the plan stops there until a lever changes. The table’s last column shows the worked example.
| Step | Deliverable | Owner in a team of one to three | From the example |
|---|---|---|---|
| 1. Customer | ICP table | Founder | 0.33 visits a monthex |
| 2. Market size | Bottom-up count | Founder | $700 million published figureex |
| 3. Competitors | Rival map | Founder | Leading rival at 25% visibilityex |
| 4. Offer | Value matrix | Founder with whoever sells | 6 quality complaintsex |
| 5. Channel | One primary channel | Whoever sells | $150 CACex |
| 6. Money test | LTV, CAC, payback | Founder | LTV/CAC 0.79ex |
| 7. Targets | Pass and fail lines | Founder | Payback 12.6 monthsex |

Step 1. Pick the customer you can reach first
For the first segment, pick a group you can name and reach this month, and one that pays on a regular cycle. A broad audience (“restaurants”) fails the first test: you cannot make a call list from it. A narrow one (“restaurants with a charbroiler inside the city limits”) passes.
| Characteristic | What to define | In the example |
|---|---|---|
| Buyer | Who signs the order | Restaurant owners and property managers |
| Trigger | Why they buy now | Scheduled fire-code cleaning |
| Cycle | How often they pay | Quarterly, 0.33 visits a monthex |
| Reach | Where you meet them | Direct outreach |
| First filter | Which ones you call first | Kitchens with high-volume cooking |
The first filter comes from the code itself. NFPA 96 requires quarterly inspection of exhaust systems that serve high-volume cooking operations, such as 24-hour cooking or charbroiling3. Those kitchens carry the quarterly cycle the example’s price assumes, so they go to the top of the list.
Test the profile against real buyers before you go live. ZoomInfo’s guide quotes a reality check from Cognism: if you have not spoken to at least 20 potential customers before going live, your ICP is still a guess4. For the method, see how to analyze your target audience.
From the example: the buyer pays on a quarterly cycle, 0.33 visits a monthex (example by our method).
Step 2. Size the market from the bottom up
A published industry figure tells you the category exists. It says nothing about one city. In our worked example, the check found a market size of USD 700 million for 2024, published by verifiedmarketreports.comex. The check does not record what geography that figure covers, so you cannot divide it down to Nashville.
Count instead: buyers × purchases a year × price. Suppose 400 Nashville kitchens run high-volume cooking (assumption). At four visits a year and the example’s $300 price per visitex, that pool is worth 400 × 4 × $300 = $480,000 a year. Replace the 400 with a count from the city’s restaurant permits and your own drive-by list, and the number becomes yours. To do the full count, size your market bottom up.
Then check whether buyers are looking. In the example by our method, the top demand phrase is “hood cleaning”ex, measured on search trendsex, and the check reads that search demand as fallingex. A falling trend has two readings. Fewer kitchens may need the service, or more of them sit on contracts and no longer search. Either way, fewer buyers will find you through search, and the channel in step 5 has to go to them.
From the example: one published figure of $700 millionex (example by our method), with no city split.
Step 3. Map who already wins your customer
Your customer already buys from someone, or decides each quarter not to. List those rivals and measure how visible each one is where buyers look. The example by our method found five rivals, four of them hood cleaning specialists:
| Rival | Type | Share of search visibility |
|---|---|---|
| HOODZ of the Midsouth | Hood cleaning | 25%ex |
| Kitchen Guard of Nashville | Hood cleaning | 20%ex |
| Excellence Janitorial Services | General janitorial | 12%ex |
| Nashville Hood Cleaning Pros | Hood cleaning | 10%ex |
| DDAN Hood Services | Hood cleaning | 7%ex |
In our example, the four specialists hold 25 + 20 + 10 + 7 = 62% of visibility between them. A new crew starts at zero in search, which is one more reason the example sells by outreach.
Visibility shows who gets found. Reviews show where those rivals fall short. Read the rivals’ local reviews and sort them by segment: restaurant owners in one pile, property managers in another. Within each pile, write down what customers praise and what they complain about. The complaints become your opening in step 4. For the full method, run a competitor analysis.
The check scores this as the top risk: a direct local rival already covers most of the offer, so a buyer may stay with the current providerex.
From the example: the most visible rival holds 25%ex (example by our method).
Step 4. Build the offer from what customers complain about
An offer that matches the rivals gives the buyer no reason to switch. Build yours from the rivals’ failures. In our worked example, the check sorted complaints into five themes. Quality has 6ex. The other four themes have 1 each: priceex, availability and minimum orderex, service and supportex, and otherex. That is 6 + 1 + 1 + 1 + 1 = 10 complaints, and quality accounts for six of them.
| Theme (complaints) | Buyer problem | Our answer | Message line |
|---|---|---|---|
| Quality (6ex) | Grease left in ducts or on the fan; an inspection at risk | Photo report of each section, before and after | “Photos of every duct, every visit.” |
| Price (1ex) | The bill differs from the quote | Fixed price per hood, set at the survey | “The quote is the invoice.” |
| Availability, minimum order (1ex) | No slot after closing; a minimum a small kitchen cannot meet | Night slots; single-hood jobs accepted | “After close, any size kitchen.” |
| Service and support (1ex) | Nobody answers after the job | One named contact per account | “One number, one person.” |
| Other (1ex) | Mixed | Read it and file it | None yet |
The answers and message lines are our proposals. Treat each as a hypothesis to test in the first 20 conversations. Ten complaints is a small sample, so ask every prospect what went wrong with the last crew and add the answers to the matrix.
Quality leads the pitch: a crew that shows clean ducts in photos gives a kitchen with a current provider a reason to listen. For the wording, see positioning and your unique offer. To gather more complaints, find customer pains in reviews.
From the example: six of ten complaints are about qualityex (example by our method).
Step 5. Choose the motion and the channel
Pick the channel from where the buyer decides. A restaurant owner decides in the kitchen, often after a walk-through with the person who will do the work. A property manager decides from a vendor list and a quote. Neither decision happens on a landing page, so the example sells by direct outreach: visits in the slow afternoon hours, and calls or emails to property management offices.
Every channel has a cost per customer, and it varies widely by channel. In its own guide, the sales-data vendor Cognism budgets $30 per content lead as its worst case and $250 per direct inbound demo request from paid ads5. Those are a software company’s figures and do not transfer to hood cleaning. They show why you measure your own cost for each channel before you pick one.
In the example by our method, winning one customer by outreach costs $150ex. That figure covers the crew’s or the founder’s time on visits and calls, quotes that never close, and any printed material. Step 6 tests whether the margin can carry it.
The section on motions below compares sales-led and product-led selling with the other approaches. For first-customer tactics, see where to find your first customers.
From the example: direct outreach at a CAC of $150ex (example by our method).
Step 6. Price it and test the unit economics before you spend
This step is the gate. Four formulas decide whether the plan goes on:
- monthly contribution = price × purchases per month × margin
- LTV = monthly contribution × lifetime in months
- LTV/CAC = LTV ÷ CAC
- payback in months = CAC ÷ monthly contribution
Here are the example’s inputs, all by our method. One visit costs $300ex. A customer buys 0.33 visits a monthex, one a quarter. The margin is 12%ex, so the crew keeps $300 × 0.12 = $36 per visit. A customer stays 10 monthsex, and winning one costs $150ex.
- monthly contribution (our example) = $300 × 0.33 × 0.12 = $11.88
- LTV = $11.88 × 10 = $118.80ex
- LTV/CAC = $118.80 ÷ $150 = 0.79ex
- payback = $150 ÷ $11.88 = 12.6 monthsex
Both stop rules fire. In our example, each customer brings back $118.80 against the $150 spent to win them. In our example, payback takes 12.6 months, but the average customer leaves at month 10. In our example, by month 10 the account has paid back $118.80 of the $150. Spending more on outreach at these inputs makes the loss bigger.
The plan does not die here. It goes back to a lever. To reach LTV/CAC = 1, one of these has to change, with the others held:
- a lifetime longer than $150 ÷ $11.88 = 12.6 months (our example);
- a a margin of at least $150 ÷ ($300 × 0.33 × 10) = 15.2% (our example);
- a CAC of $118.80 or less (our example).
Price is a fourth lever. The worked example below tests each one. Run your own inputs through the unit economics calculator. The logic behind each term is in unit economics in plain words, and pricing method is in how to set a price.
From the example: LTV/CAC of 0.79ex (example by our method), below the line of 1.
Step 7. Set targets you can test in one quarter
Work backward from the money. Step 6 gives the most you can pay to win a customer and still break even: the LTV. Pick a contract target for the quarter, then derive the activity it needs.
Cognism’s capacity model goes from activities to meetings to opportunities, then applies a 25% opportunity-to-close rate to get deals5. That rate is a software vendor’s own planning figure. For a local service, start with it as an assumption and replace it after the first month.
Take the example. Target: 10 signed quarterly contracts in one quarter (assumption). In our example, a 25% close rate on quotes (assumption, taken from Cognism’s model) means you need 40 quotes. In our example, if one in four conversations leads to a site survey and a quote (assumption), you need 160 conversations, or about 12 a week over 13 weeks. To break even on acquisition, total outreach cost for those 10 contracts must stay at or below 10 × $118.80 = $1,188, using the example’s LTVex.
Write two lines before you start:
- Pass (our example): 10 contracts signed at an acquisition cost of $1,188 or less (assumption).
- Fail: fewer than 5 contracts, or a cost per contract above the example’s $150 CACex (assumption). At that point you go back to step 4 or step 6 before you continue.
A cheaper first test is a demand check before any outreach budget. See test demand before launch. For the week-by-week sequence after the plan, see a 90-day launch roadmap.
From the example: payback of 12.6 monthsex (example by our method) is the number the targets must bring under the 10-month lifetime.
Sales-led, product-led and the other motions
The motion is how the sale happens. The channel is where the first contact happens. Choose the motion from what the buyer needs before they pay.
| Motion | Best for | Main metric | Signal to choose it |
|---|---|---|---|
| Sales-led | Contracts, quotes, site work | Close rate, sales cycle | The buyer needs a conversation or a survey before paying |
| Product-led | Software people can try alone | Free-to-paid conversion | A user gets value in the first session without help |
| Marketing-led | Buyers who search and compare | Cost per lead | Search demand for the problem is steady or rising |
| Partner-led | Buyers someone else already serves | Partner-sourced revenue | Another firm already holds the relationship |
Sales-led. A salesperson handles each deal from the first call to the signed quote. It costs more per customer and suits deals where the buyer wants to see who will do the work. Field sales is its local form: the seller goes to the buyer.
Product-led. The product does the selling. A user who gets a result after signing up pays to keep going. Paddle reports in its customer story on Kaleido that remove.bg, an image tool, launched in 20 countries and reached 43,000 customers across 181 countries within 18 months6. That is the vendor’s own account, and that reach is possible only when no salesperson stands between the user and the result.
Marketing-led. Content and ads, search included, bring the buyer in, and a short sales step or a checkout closes the sale. It needs steady search demand.
Partner-led. Distributors and other partners sell for you. For a hood cleaning crew, a partner could be a fire-suppression installer or a kitchen equipment repair firm that already visits the same kitchens.
Teams combine motions. A software product can run product-led for small accounts and sales-led for large ones. A service business can start sales-led and add a partner channel once it has proof of quality to show.
The example fits the first row: a field service sold by a person in one city, through direct outreach to restaurant owners and property managers. The kitchen wants to see the crew before it signs, and search demand is falling, which rules out a marketing-led start.
How we check a go-to-market plan
Our idea check reads an idea the way a GTM strategy has to: customer, market, rivals, complaints, money, risks. It runs a fixed sequence:
- It runs search queries and reads sources: 17 queriesex and 27 sourcesex in the example (example by our method).
- It measures demand on the top search phrase and its trend.
- It finds a published market size.
- It lists competitors with their share of search visibility.
- It sorts customer complaints into themes.
- It computes unit economics.
- It scores risks by probability and impact.
- It gives a verdict with a score.
The unit economics use five inputs:
| Variable | Meaning | The example |
|---|---|---|
| Price | What one purchase costs the customer | $300ex |
| Purchases per month | Purchases a month (0.33 = one a quarter) | 0.33ex |
| Margin | Share of each payment you keep after delivering it | 12%ex |
| Lifetime | Months a customer stays | 10ex |
| CAC | Cost to win one customer | $150ex |
All values in this table are the example by our method. The four formulas are the ones in step 6: contribution = price × purchases per month × margin; LTV = contribution × lifetime; LTV/CAC = LTV ÷ CAC; payback = CAC ÷ contribution.
The stop rules follow from the arithmetic. They are not benchmarks:
- LTV/CAC below 1. Each customer returns less than it cost to win at the stated CAC. Fix a lever before you buy any channel.
- Payback longer than lifetime. The customer leaves before you earn the CAC back.
Above 1, the plan breaks even on acquisition. It does not yet pay for overhead or growth. The most common benchmark for recurring-revenue businesses is an LTV-to-CAC ratio of 3:17. In the example, reaching 3:1 at the current LTV would require a CAC of $118.80 ÷ 3 = $39.60ex.
We quote the verdict and score exactly as the check reports them. The risk scores are the check’s own probability and impact ratings, given here without a scale.
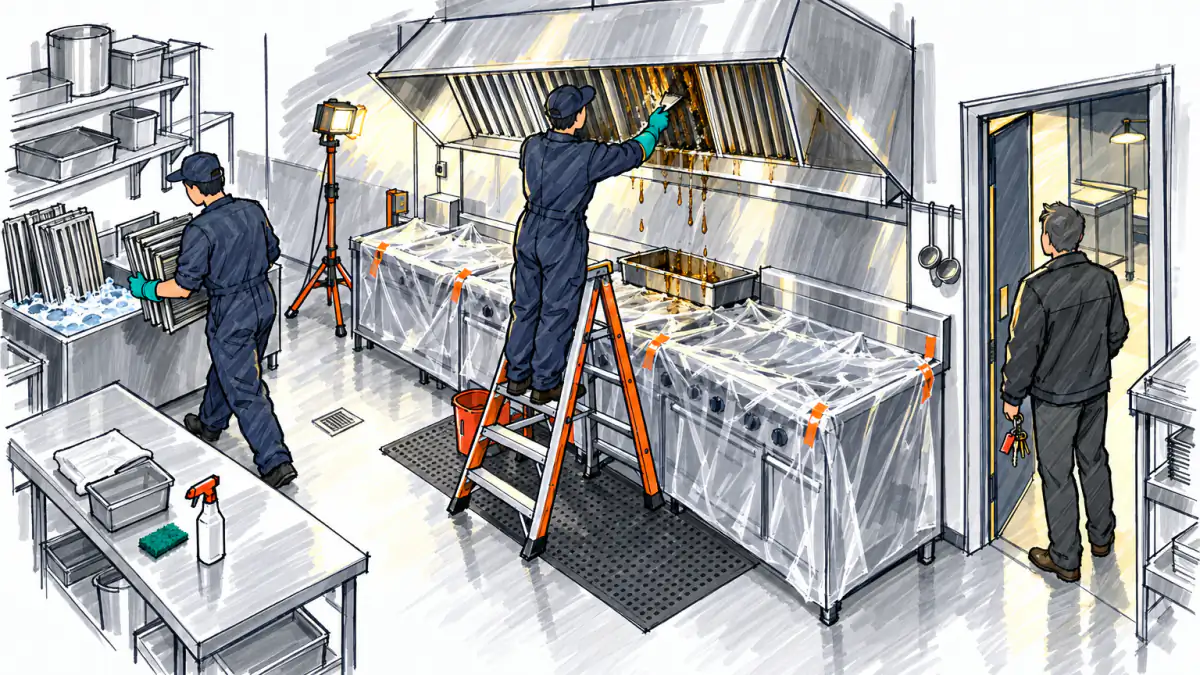
Worked example: a hood cleaning service in Nashville
The idea, as entered: “Kitchen exhaust hood cleaning service in Nashville: restaurant owners and property managers on quarterly fire-code cleaning contracts, won by direct outreach”ex. We ran the check on the topic of this article. Example by our method: 17 search queriesex, 27 sourcesex, verdict “Possible, with caveats”ex, score 48ex.
Here is the check mapped onto the seven steps, all figures by our method:
| Step | What the check found |
|---|---|
| 1. Customer | Restaurant owners and property managers, billed quarterly at 0.33 visits a monthex |
| 2. Market | Published size USD 700 million, 2024ex, scope not recorded; top phrase “hood cleaning”ex with falling demandex |
| 3. Competitors | Five rivals; HOODZ of the Midsouth at 25%ex, Kitchen Guard of Nashville at 20%ex |
| 4. Offer | Quality complaints 6ex; each other theme 1 |
| 5. Channel | Direct outreach, CAC $150ex |
| 6. Money | LTV $118.80ex; LTV/CAC 0.79ex; payback 12.6 monthsex against a 10-month lifetimeex |
| 7. Targets | Must bring payback under lifetime before outreach scales |
The check lists four risks. Two score 3 for probability and 3 for impact. A local rival already covers most of the offerex. Quarterly visits at $300 with a 12% margin may not cover acquisition, at an LTV/CAC of 0.79ex. Two score 2 and 2: falling search demandex, and existing quality complaints that a new crew must outperform from the first visitex.
The verdict reads as the plan does. The customer and the reason to buy exist: a code requirement on a fixed cycle. An opening exists in quality. At the stated inputs, each customer loses money on acquisition.
What would fix the money
Each row changes one lever. The new value in each row is an assumption, and the other inputs stay at the example’s values: $300 priceex, 0.33 visits a monthex, 12% marginex, 10-month lifetimeex, $150 CACex.
| Lever | Change (assumption) | LTV/CAC | Payback |
|---|---|---|---|
| None | As checked | 0.79ex | 12.6 monthsex |
| Longer stay | Annual contracts keep customers 24 months (assumption) | $285.12 ÷ $150 = 1.90 | 12.6 months, now inside lifetime |
| Shared CAC | One property manager brings 3 kitchens, so $150 splits to $50 per site (assumption) | $118.80 ÷ $50 = 2.38 | $50 ÷ $11.88 = 4.2 months |
| Higher margin | A filter-exchange add-on lifts margin to 18% (assumption) | $178.20 ÷ $150 = 1.19 | $150 ÷ $17.82 = 8.4 months |
| Cheaper acquisition | Referrals bring CAC to $100 (assumption) | $118.80 ÷ $100 = 1.19 | $100 ÷ $11.88 = 8.4 months |
The shared-CAC row moves the ratio furthest, and it points back to step 1. Property managers who run several kitchens are a better first segment than single restaurants, because one sale covers several sites. That changes the ICP, and with it the call list and message line, which is why the money test sits before the targets and not after.
To run the same check on your own idea, use the link below. It returns the same sections, with your figures in place of these.
Measure it: the numbers to watch each month
Salesforce lists customer acquisition cost and customer lifetime value among the KPIs a GTM team should track, along with conversion rate8. Each number below traces back to the step that set its line.
| KPI | Set in | Line | Type |
|---|---|---|---|
| Conversations per week | Step 7 | Your weekly share of the quarterly plan | Operational |
| Quote-to-contract rate | Step 7 | The close rate you assumed | Operational |
| CAC | Steps 5 and 6 | At or below LTV | Financial |
| LTV/CAC | Step 6 | Above 1; 3:1 is the common benchmark7 | Financial |
| Payback | Step 6 | Shorter than customer lifetime | Financial |
| Review rating and complaint themes | Steps 3 and 4 | No complaints in the theme you promised to fix | Brand |
Review the numbers once a month. Compare each against its line, and rework only the step whose number missed. A low quote-to-contract rate sends you back to the offer in step 4. A high CAC sends you back to the channel in step 5.
At each review, put the three questions below to the people who sell and do the work. Which prospects said no, and what reason did they give? Which rival did they name? What did a customer complain about after a visit? The answers update the rival map and the value matrix faster than any dashboard.
Who owns it, and how B2B and B2C differ
Who owns it
One person is accountable for each activity, and one person owns the whole plan. Two owners for the same line means nobody acts when the number misses.
| Activity | Accountable in a larger team | In a founder-led team |
|---|---|---|
| Customer and segment | Head of product or marketing | Founder |
| Price and unit economics | Finance lead | Founder |
| Offer and message | Marketing lead | Founder, tested by whoever sells |
| Pipeline and outreach | Sales lead | Founder or first salesperson |
| Monthly review | The GTM owner | Founder |
B2B vs. B2C
| Factor | B2B | B2C |
|---|---|---|
| Sales cycle | Weeks to months | Minutes to days |
| People in one decision | Often several | Usually one or a household |
| Main channel | Outreach, partners, referrals | Search, social, retail |
| Message | Cost, risk, proof | Feeling, convenience, price |
The example is B2B. The restaurant owner weighs a failed inspection and a closed kitchen against the cost of the visit. The property manager also answers to the building owner, so the photo report from step 4 doubles as proof that person can forward.
Where go-to-market plans break
Each failure has a number that exposes it and a fix. The first two come from the example’s risks.
- A rival already holds the buyer. The example scores this risk at 3 for probability and 3 for impactex. The number: the share of conversations that end with “we already have someone.” The fix: lead with the rival’s weak point, quality in the example, and offer a single trial visit before any contract.
- The margin does not cover CAC. Also 3 and 3 in the exampleex. The number: LTV/CAC below 1. The fix: change a lever from step 6 before spending more on outreach.
- The ICP is a guess. The number: fewer than 20 conversations with potential customers before going live, the threshold in the Cognism check that ZoomInfo quotes4. The fix: hold the launch until you have them.
- Demand is shrinking. Scored 2 and 2 in the exampleex. The number: the search trend on your top phrase. The fix: move budget from search to outreach and partners, and measure inbound inquiries each month.
- The quality promise slips. Scored 2 and 2 in the exampleex. The number: new complaints in the theme you promised to fix. The fix: a checklist and a photo report on every job, reviewed weekly.
For a wider list of what to test, see risks to check before launch.
Next step
Before you spend on any channel, run the money test from step 6 with your own five inputs. If LTV/CAC comes out below 1, change the lever with the most room before you set targets.
FAQ
What are the key components of a go-to-market strategy?
Seven. The first covers the target customer and market size; the rest cover competitors, the offer and message, the motion and channel, price with unit economics, and the targets. The table in the first section lists each step’s deliverable.
What is the difference between a go-to-market strategy and a marketing plan?
The GTM strategy is tied to one launch and ends when the launch proves or fails its targets. The marketing plan runs inside it and continues afterward, with campaigns, a calendar and a budget.
What is the difference between a sales-led and a product-led go-to-market?
In a sales-led motion, a salesperson handles each deal from the first call to the quote. In a product-led motion, the user tries the product alone and pays to keep using it. Choose sales-led if the buyer needs a conversation or a site visit before paying. Choose product-led if a user gets value in the first session without help.
Who owns the go-to-market strategy?
One accountable person, with one owner per activity under them. In a team of one to three people, that person is the founder.
How often should you update a go-to-market strategy?
Review the numbers every month. Rework a step when its number misses its line, and leave the steps whose numbers hold.
What are the 4 Ps, and how do they relate to a GTM strategy?
The 4 Ps are product, price, place and promotion. Of the seven steps, step 4 covers product and promotion through the offer and the message. Step 5 covers place as the channel, and step 6 covers price.
Does a small local service business need a go-to-market strategy?
How do you set go-to-market targets?
Start from LTV, because it sets the most you can pay to win a customer. Pick a contract target, then divide by your close rate and your meeting rate to get the number of conversations you need. Write a pass line and a fail line before you start.
Sources
- en.wikipedia.org, 04/20/2008
- online.hbs.edu, 07/13/2023
- muni.org, 09/22/2025
- pipeline.zoominfo.com, 07/02/2026
- cognism.com, 05/20/2026
- paddle.com, 10/08/2026
- firstpagesage.com, 04/17/2025
- salesforce.com, 09/04/2025
Check your idea for free
Describe your idea and the check collects demand, competitors, complaints and prices, with sources.